
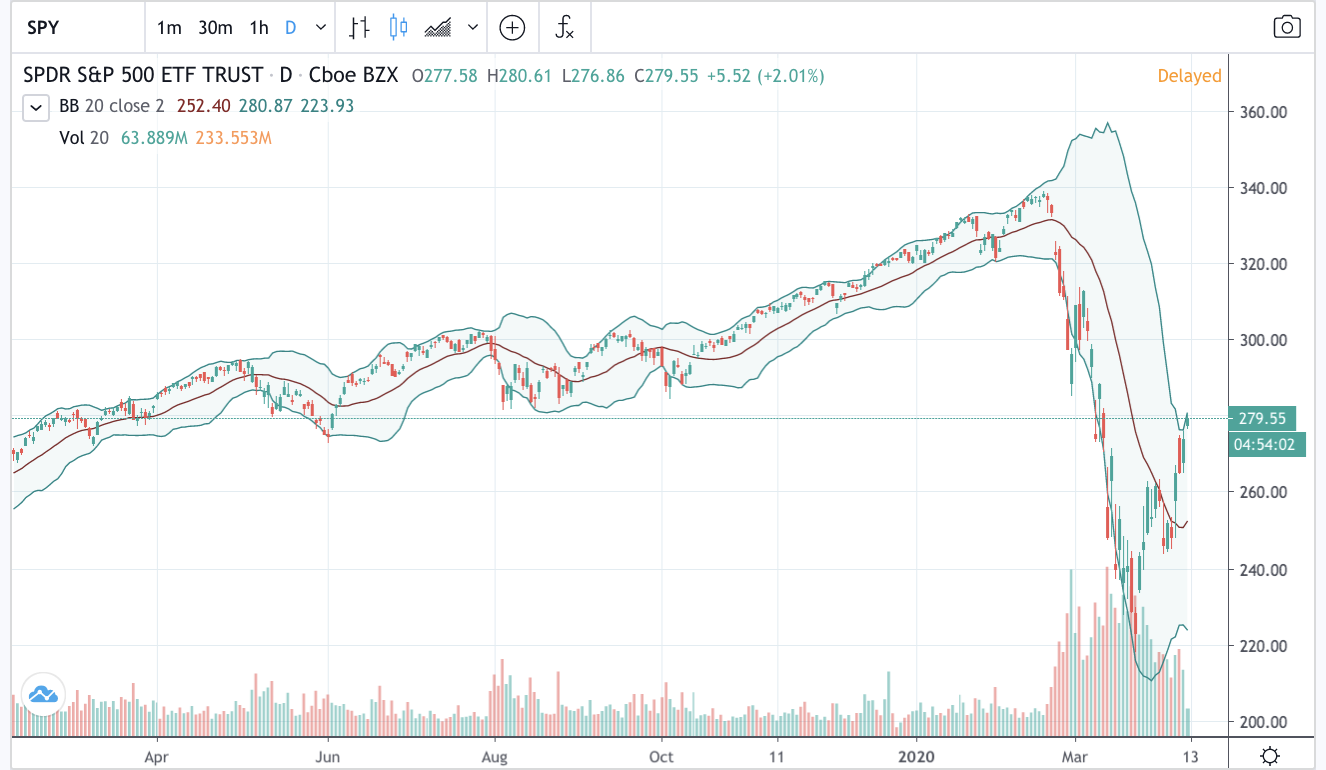
SPY Chart by TradingView
In the 1980s, John Bollinger, an American author, Financial analyst and contributor to the field of technical analysis developed the indicator “Bollinger Bands” Bollinger bands are a functional tool that combines moving averages and standard deviations which makes it one of the most popular technical analysis tools. Bollinger bands are the first technical analysis tool I learned to use, and it shows when the market is being overbought or oversold. There are three factors to the Bollinger band indicator
- Moving average: A 20-period simple moving average is used.
- Upper band: shows a level that is statistically high or expensive.
- Lower band: shows a level that is statistically low or cheap. The Bollinger bandwidth correlates to the volatility of the market.
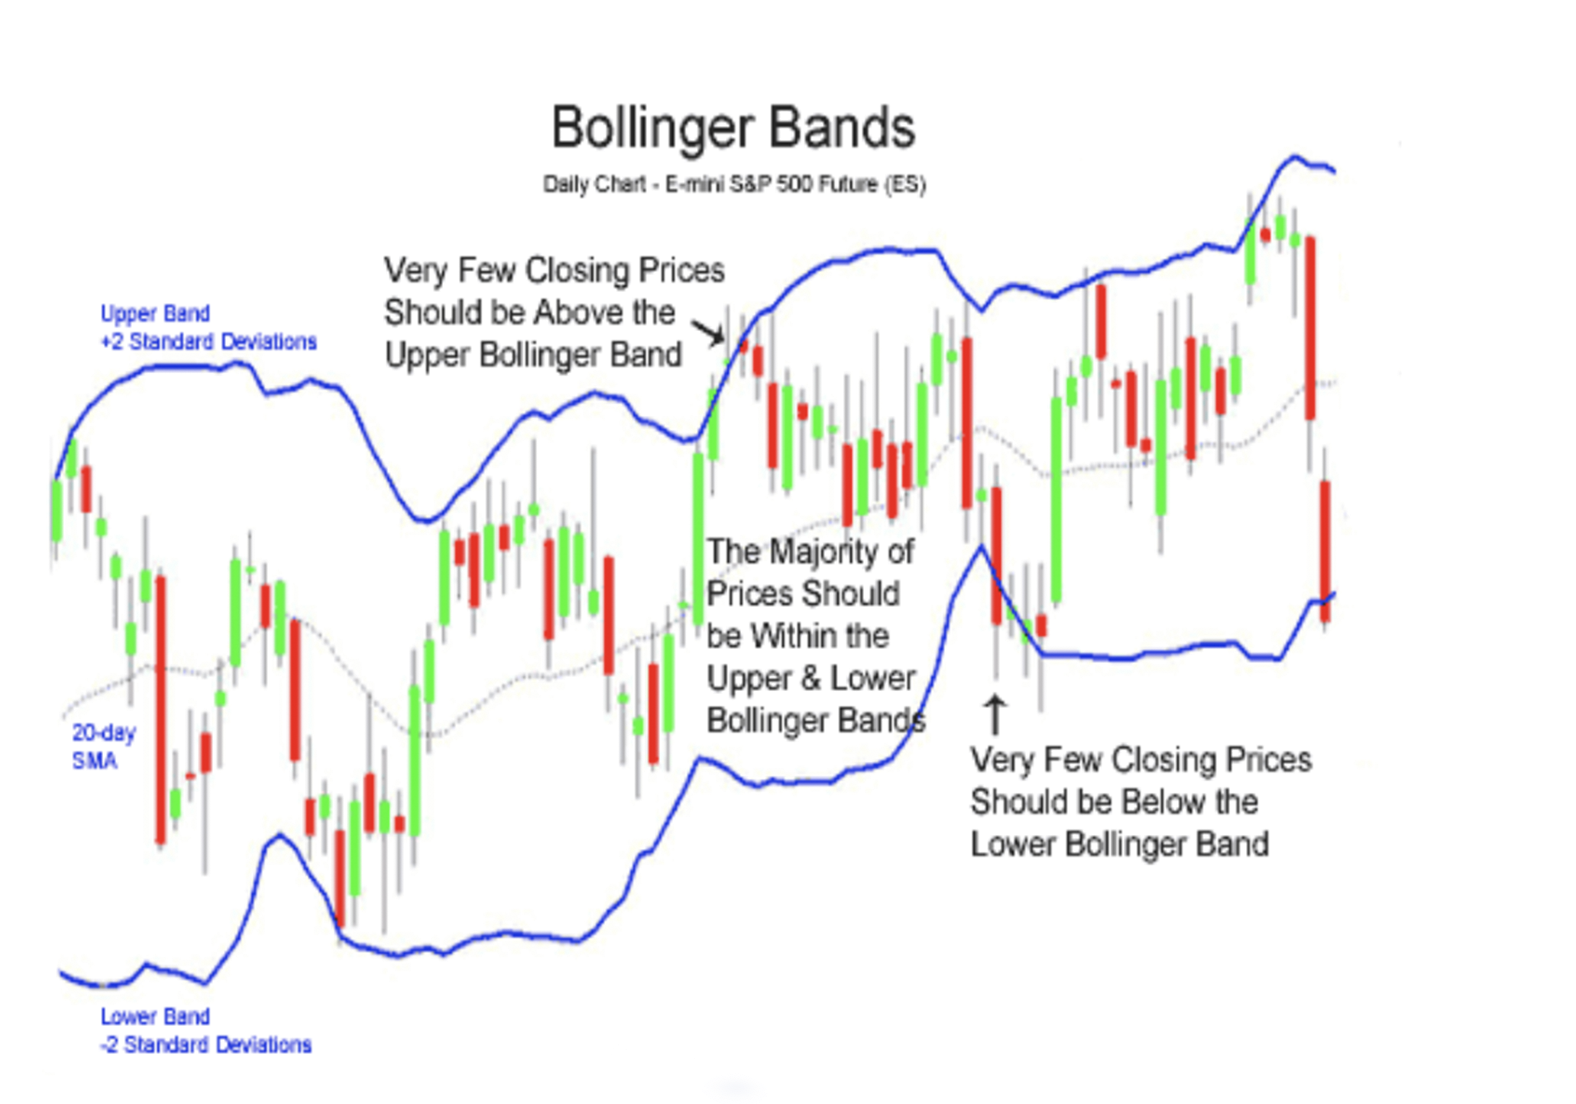
Using Bollinger Bands
Bollinger bands indicate the end of a strong buy or sell trend. They are essential because it tells when a stock is being overbought or oversold. Bollinger bands designate the upper and lower bands as price targets if the price deflects off the lower band and crosses the middle line, the upper band comes to represent the upper price target. In a strong uptrend, prices usually fluctuate between the upper band and the 20-day moving average.
The Bollinger Bounce
When using Bollinger bands, one thing you should really watch out for is that price tends to return to the middle of the bands.
This indicates that the market is being oversold, and most likely, a sell signal is coming.
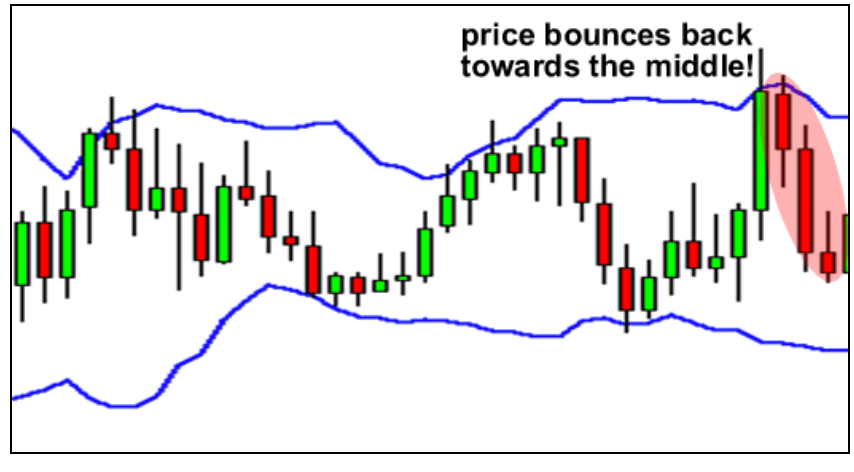
This is an example of the Bollinger bounce, the reasons these bounces occur is because the bands act like support and resistance levels to the price of the stock. The bigger the timeframe you’re in, the more accurate these bands tend to be. I use the groups in the 1-hour and 4-hour timeframe because I am a long term investor and like to know when the stocks I own or either being oversold or overbought.
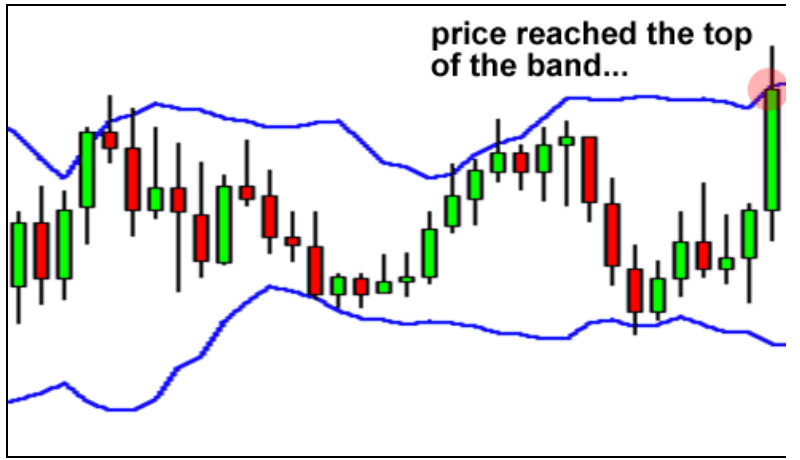
Bollinger Squeeze
The Bollinger Squeeze is when the bands squeeze together, which usually means that a price breakout is getting ready to happen.
-If the candles start to break out above the top band, then the stock will often continue to go UP.
-If the candle begins to break out below the bottom band, then it will indicate that the price will continue to go down.
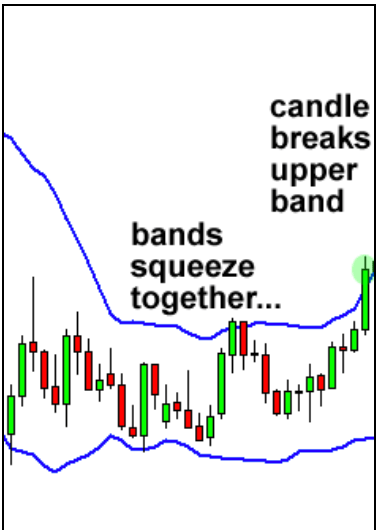
The chart above shows the bands squeezing together; the price has just started to break out on the top hand. The price will most likely then shoot up.
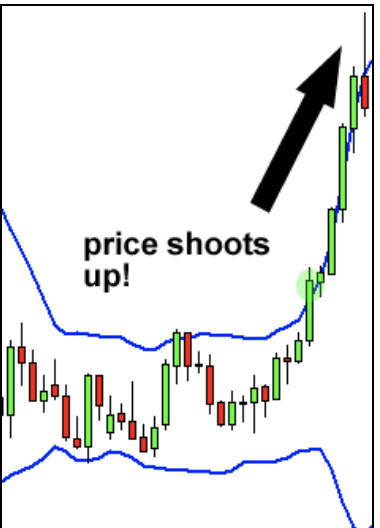
This is how a typical Bollinger Squeeze works. This strategy is used for you to catch a stock move as early as possible. Setups like these do not occur each day, you can spot them a few times a week. A good way to practice this strategy is on a demo trading account, then when you get a good feel for it, its time to try it with real money.
Conclusion
There are many other things you can do with Bollinger bands, but these are the two most common strategies used with them. But, remember too, that they can also be combined with other indicators. Since they are a pure price indicator, you might want to consider using volume indicators for even more insight on a stocks price movement, Ultimately, no indicator guarantees you’ll always get in at the bottom or out at the top. However, Bollinger Bands—especially when paired with other indicators such as chart pattern recognition tool can help you make better investing decisions.

Leave a reply to tigheee Cancel reply