

The relative strength index AKA “RSI” is a momentum indicator that shows when a stock or ETF is either overbought or oversold. It was developed by J. Welles Wilder back in the 70s. The RSI is displayed at the bottom of your chart and is displayed as an oscillator. The RSI has readings from 0 to 100; when an asset is overbought, the RSI is above 70%, while when an asset is oversold, it is below 30% on the RSI line.

Overbought Vs. Oversold
In an uptrend or bull market, the RSI tends to remain 40 to 90, with the 40-50 zone acting as support. During a downtrend or bear market, the RSI tends to stay between the 10 to 60 range, with the 50-60 zone acting as resistance.
The goal of using the RSI is for shareholders to assess when a stock is overbought, which usually is an excellent time to take some profit and sell the stock before it has a correction.
a Security is oversold when demand for that stock weakens, usually after bad earnings about the underlying company or if a specific financial industry is crushed like the Oil industry back in March.
When a stock declines in value for no crystal-clear reason, the RSI can be invaluable in classifying an approximate point where the share price slides so far down the band that the stock likely is oversold and represents a good buying opportunity. Figuring out when the perfect time to buy stock in decline is a job made more comfortable with solid RSI technical analysis review.
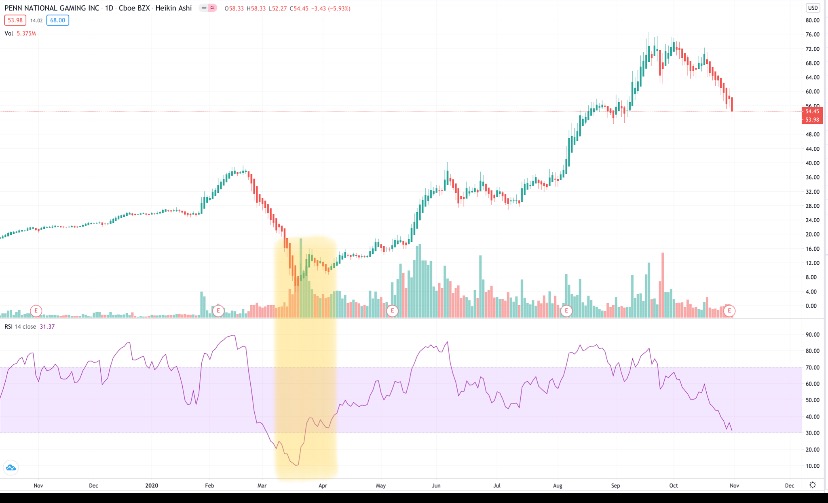
Below is a perfect example of RSI being oversold. $PENN was at a low of $3.75 and soared to a high of $76.62.
The next Chart Shows Draft Kings $DKNG perfectly touching 30 on the RSI line which would of been a great opportunity for some serious profit.

These are just two simple examples of how the RSI indicator works. Usually it should be paired with other indicators like EMA’S and MACD, but it is a great beginner indicator that shows how the market moves in waves and peoples emotions cause them to overbuy or oversell a stock very often. I wouldn’t buy a stock solely on RSI analysis but i would use RSI to my advantage to clearly identify when a stock is overbought or oversold.

Leave a comment