

The 200-day moving average is an excellent indicator of the chart when to profit on a company you went long-on. Staying on the right side of a long term trend can be as easy as the stock staying above the 200-day moving average. A loss of the 200-day is your first warning of a possible downtrend or correction within a stock or the full market. This simple statistic alone could save you a plot of money as a swing trader or long term investor.
After a long bear market and traders have much cash built up in their account, a great entry to go long is when a stock breaks through the 200-day moving average. An entry on the first close above a 200-day presents the trader or investor a great risk/reward entry for the beginning of a new bull market.
A perfect example of the 200-day moving average is apples chart below. The bottom left shows that the trend broke the moving average to go to an all-time low. Then the trend broke the 200-day line, and if you were to go long, you would have made over a 100% gain by following that one rule “go long is when a stock breaks through the 200-day moving average.“

The 200-day provides strong support in range-bound markets for high growth stocks that explode in uptrends during bull markets.
Below is a Tesla chart that shows the 200-day moving average being executed correctly.
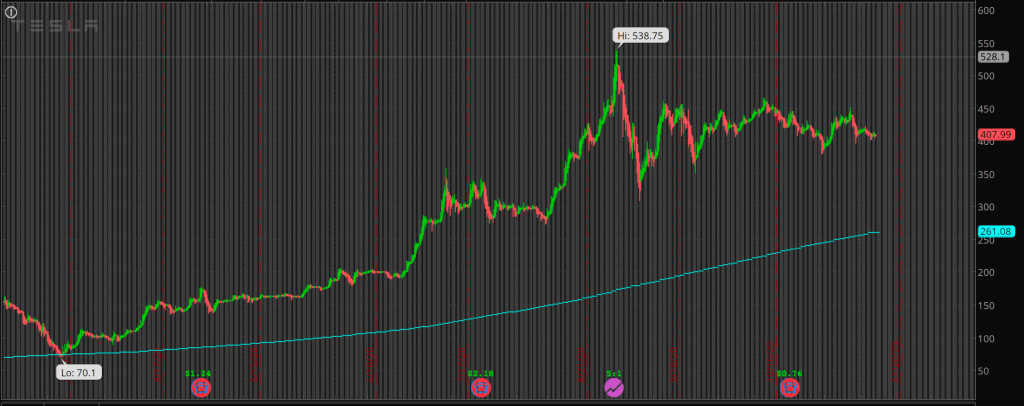
If you were to buy one share of Tesla once it broke out of that 200 days moving average, you would have made $468 per share. This chart is a perfect example of trusting your trading signals. You could amass a ton of money by trusting the process.
The 200-day gives the trader the ability to quantify the market environment they are in and understand long-term trends. The 200-day is the ultimate line in the sand that divides bull markets from bear markets. When the 200 day breaks, bulls start to take profits and put their money to cash while bears start getting ready to short the market into the next recession. Strong moves occur at this line, and Bull markets that have momentum and make all-time highs must overtake the 200-day moving average to get there. Markets that have long term downtrends must first cross the 200-day moving average before any damage is done.
If traders and investors had respected this signal in the crash of 09-10 would have saved themselves a ton of money. Long term trend followers should not belong to markets under the 200-day moving average ever.

Leave a comment